You have no items in your shopping cart.
Description
Images & Validation
−Item 1 of 6
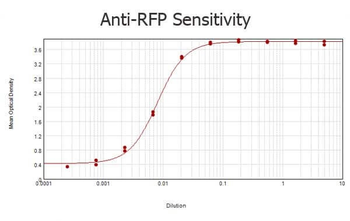
| Tested Applications | ELISA, WB |
|---|---|
| Dilution Range | ELISA: 1:10,000, WB: 1:2,000 - 1:3,000 |
| Reactivity | Other |
| Application Notes |
Key Properties
−| Antibody Type | Primary Antibody |
|---|---|
| Host | Gallus |
| Clonality | Polyclonal |
| Isotype | IgY |
| Immunogen | Red Fluorescent Protein (RFP) fusion protein corresponding to the full length amino acid sequence (234aa) derived from the mushroom polyp coral Discosoma. |
| Target | DsRed |
| Purity | RFP Antibody was prepared from egg yolks by a multi-step process which includes filtration, delipidation, salt fractionation and extensive dialysis against the buffer stated above. RFP Antibody was tested by western blot. |
| Conjugation | Unconjugated |
Storage & Handling
−| Storage | Store vial at -20° C or below prior to opening. This vial contains a relatively low volume of reagent (25 µL). To minimize loss of volume dilute 1:10 by adding 225 µL of the buffer stated above directly to the vial. Recap, mix thoroughly and briefly centrifuge to collect the volume at the bottom of the vial. Use this intermediate dilution when calculating final dilutions as recommended below. Store the vial at -20°C or below after dilution. Avoid cycles of freezing and thawing. |
|---|---|
| Form/Appearance | Liquid (sterile filtered) |
| Buffer/Preservatives | Preservative: 0.01% (w/v) Sodium Azide. Stabilizer: None; Buffer: 0.02 M Potassium Phosphate, 0.15 M Sodium Chloride, pH 7.2 |
| Concentration | 1.0 mg/mL |
| Expiration Date | 12 months from date of receipt. |
| Dry Ice Shipping | Please note: This product requires shipment on dry ice. A dry ice surcharge will apply. |
| Disclaimer | For research use only |
Alternative Names
−chicken anti-RFP antibody, DsRed, rDsRed, Discosoma sp. Red Fluorescent Protein, Red fluorescent protein drFP583
Similar Products
−- Item 1 of 45
DsRed Antibody [orb345391]
ELISA, FC, IF, IHC, KO/KD Validated, WB
Other
Rabbit
Polyclonal
Unconjugated
100 μg - Item 1 of 45
DsRed Antibody [orb345392]
ELISA, FC, IF, IHC, KO/KD Validated, WB
Other
Rabbit
Polyclonal
Unconjugated
25 μl - Item 1 of 2
tdTomato Antibody [orb182397]
ELISA, FACS, IF, IHC-Fr, IHC-P, WB
Other
Goat
Polyclonal
Unconjugated
100 μg - Item 1 of 4
mCherry Goat Polyclonal Antibody [orb11618]
FC, ICC, IEM, IF, IHC-Fr, IHC-P, WB
Other
Goat
Polyclonal
Unconjugated
20 μg, 100 μg - Item 1 of 12


Quality Guarantee
Explore bioreagents carefree to elevate your research. All our products are rigorously tested for performance. If a product does not perform as described on its datasheet, our scientific support team will provide expert troubleshooting, a prompt replacement, or a refund. For full details, please see our Terms & Conditions and Buying Guide. Contact us at [email protected].
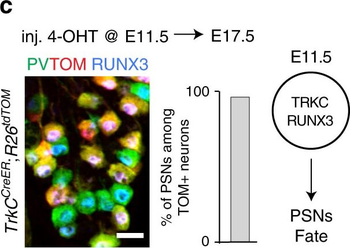
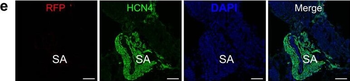
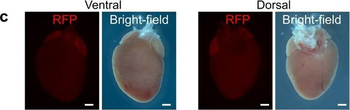
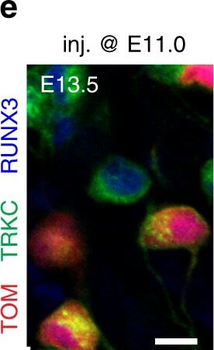
Differential expression of TRKC in PSNs prior to the cell death period. a Scheme of our working hypothesis. b, c Temporal fate mapping of TRKC PSNs by 4-OHT induction. TrkCCreER mice allow temporary activation of CreER in the TRKC + cells 2 h after 4-OHT injection21, 22. Immunostaining for PV, RFP and RUNX3 on E17.5 DRG sections (c) and graph showing distribution of PV + /RUNX3 + PSNs among the TOM + cells (n = 4). Scale bar: 20 µm. d Quantification of PSNs at C5 and C7. ***P < 0.001, one-way analysis of variance (ANOVA) with Sidak's multiple comparisons test (n = 2–3). The window of PSNs cell death is shown. e TRKC expression in E11.5 ISL1 + (and RUNX3 +, whose staining is not shown for more visibility) DRG neurons. Scale bar: 50 µm. f TRKC levels in PSNs of e illustrated by color coding; dark blue indicates the lower and red the higher TRKC levels. From here, all observations are done at brachial levels (C5–8). g Distribution of TRKC levels in PSNs from e. h Distribution of TRKC levels in PSNs in E11.5 DRG neurons (from g). The data exhibit a Poisson-like distribution (one representative animal), with the mean used to define the two different categories of TRKC intensity (TRKCHigh and TRKCLow). i Projection of seven images of RUNX3 + /TRKC + PSNs from one brachial DRG; dots indicate TRKC-labeled neurons and color codes reveal TRKC intensity as shown in h. j Projection image of smFISH for pan Ntrk3 and Ntrk3 full length (FL) transcripts in E11.5 DRG, visualized at high magnification in (1) and (2) (images show full projection); right panel shows color coding of Ntrk3 FL levels in red; the brighter, the higher levels. k Distribution of the number of Ntrk3 FL molecules in E11.5 DRG neurons by smFISH, normalized to pan Ntrk3 (Ntrk3 FL represent 68% of all Ntrk3 transcripts). lTrkCCreER;R26tdTOM mice were injected at E9.75 with 4-OHT and analyzed at E11.5 (n = 3). m, n Frequency distribution (m) and pie chart (n) of TOM + /TRKC + neurons from l according to their level of TRKC intensity.
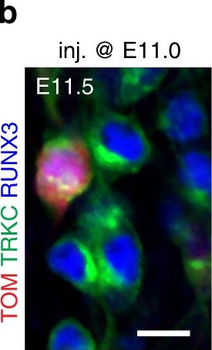
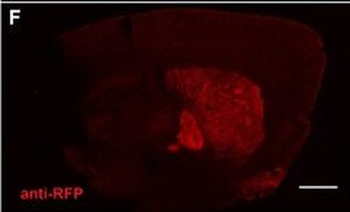
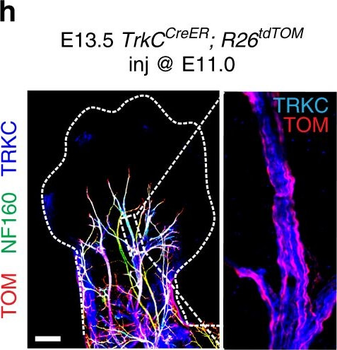
PSNs with high TRKC levels preferentially survive the cell death period. a Temporal fate mapping of TRKCHigh PSNs by 4-OHT (low dose, 0.02 g/kg). b–d Injection of TrkCCreER;R26tdTOM mice with low dose of 4-OHT at E11.0; DRG analyzed at E11.5 with recombination in few (b), preferentially high TRKC PSNs (c, d) (P < 0.001). Frequency distribution of TOM+ PSNs according to TRKC intensity (c) and pie charts (d) illustrating the large proportion of TOM+ cells among TRKCHigh PSNs. Scale bar: 50 µm. e, f Percentage of recombined PSNs at E11.5 and E13.5 in DRGs from TrkCCreER;R26tdTOM animals after 4-OHT injection at E11.0 (*P < 0.05, Student's t-test; n = 2 litters with 6 embryos, E11.5; 2 litters with 5 embryos, E13.5). g The percentage of labeled PSNs does not change between E11.5 and E13.5 in R26CreERT2;R26tdTOM embryos injected at E11.0 with 0.032 g/kg 4-OHT (n = 4). Similarly, the recombination rate in TOM+ PSNs does not change between E14.5 and E16.5 in TrkCCreER;R26tdTOM embryos after injection at E14.0 with 0.02 g/kg 4-OHT (n = 2). Unpaired Student's t-test. h Whole-mount immunostaining for TRKC, NF160 and RFP of E13.5 forelimb from TrkCCreER;R26tdTOM embryos injected with low dose 4-OHT at E11.0. Insert shows restricted number of TOM+ fibers dispersed amongst TRKC+ axons. Scale bar: 200 µm. i Pattern and color-coded depth (in micrometers) of innervation of TRKC+, NF160+ and RFP+ nerve fibers (processed from h) of E13.5 forelimb from TrkCCreER;R26tdTOM embryos injected with a low dose of 4-OHT (0.02 g/kg) at E11. The pattern and depth color code reveal similar territories (in all dimensions, xyz) of innervation of the TOM+ PSNs compared to all axons (NF160). Scale bar: 200 µm. j Scheme illustrating the preferential selection of TRKCHigh PSNs during the cell death period.
PSNs with high TRKC levels preferentially survive the cell death period. a Temporal fate mapping of TRKCHigh PSNs by 4-OHT (low dose, 0.02 g/kg). b–d Injection of TrkCCreER;R26tdTOM mice with low dose of 4-OHT at E11.0; DRG analyzed at E11.5 with recombination in few (b), preferentially high TRKC PSNs (c, d) (P < 0.001). Frequency distribution of TOM+ PSNs according to TRKC intensity (c) and pie charts (d) illustrating the large proportion of TOM+ cells among TRKCHigh PSNs. Scale bar: 50 µm. e, f Percentage of recombined PSNs at E11.5 and E13.5 in DRGs from TrkCCreER;R26tdTOM animals after 4-OHT injection at E11.0 (*P < 0.05, Student's t-test; n = 2 litters with 6 embryos, E11.5; 2 litters with 5 embryos, E13.5). g The percentage of labeled PSNs does not change between E11.5 and E13.5 in R26CreERT2;R26tdTOM embryos injected at E11.0 with 0.032 g/kg 4-OHT (n = 4). Similarly, the recombination rate in TOM+ PSNs does not change between E14.5 and E16.5 in TrkCCreER;R26tdTOM embryos after injection at E14.0 with 0.02 g/kg 4-OHT (n = 2). Unpaired Student's t-test. h Whole-mount immunostaining for TRKC, NF160 and RFP of E13.5 forelimb from TrkCCreER;R26tdTOM embryos injected with low dose 4-OHT at E11.0. Insert shows restricted number of TOM+ fibers dispersed amongst TRKC+ axons. Scale bar: 200 µm. i Pattern and color-coded depth (in micrometers) of innervation of TRKC+, NF160+ and RFP+ nerve fibers (processed from h) of E13.5 forelimb from TrkCCreER;R26tdTOM embryos injected with a low dose of 4-OHT (0.02 g/kg) at E11. The pattern and depth color code reveal similar territories (in all dimensions, xyz) of innervation of the TOM+ PSNs compared to all axons (NF160). Scale bar: 200 µm. j Scheme illustrating the preferential selection of TRKCHigh PSNs during the cell death period.
PSNs with high TRKC levels preferentially survive the cell death period. a Temporal fate mapping of TRKCHigh PSNs by 4-OHT (low dose, 0.02 g/kg). b–d Injection of TrkCCreER;R26tdTOM mice with low dose of 4-OHT at E11.0; DRG analyzed at E11.5 with recombination in few (b), preferentially high TRKC PSNs (c, d) (P < 0.001). Frequency distribution of TOM+ PSNs according to TRKC intensity (c) and pie charts (d) illustrating the large proportion of TOM+ cells among TRKCHigh PSNs. Scale bar: 50 µm. e, f Percentage of recombined PSNs at E11.5 and E13.5 in DRGs from TrkCCreER;R26tdTOM animals after 4-OHT injection at E11.0 (*P < 0.05, Student's t-test; n = 2 litters with 6 embryos, E11.5; 2 litters with 5 embryos, E13.5). g The percentage of labeled PSNs does not change between E11.5 and E13.5 in R26CreERT2;R26tdTOM embryos injected at E11.0 with 0.032 g/kg 4-OHT (n = 4). Similarly, the recombination rate in TOM+ PSNs does not change between E14.5 and E16.5 in TrkCCreER;R26tdTOM embryos after injection at E14.0 with 0.02 g/kg 4-OHT (n = 2). Unpaired Student's t-test. h Whole-mount immunostaining for TRKC, NF160 and RFP of E13.5 forelimb from TrkCCreER;R26tdTOM embryos injected with low dose 4-OHT at E11.0. Insert shows restricted number of TOM+ fibers dispersed amongst TRKC+ axons. Scale bar: 200 µm. i Pattern and color-coded depth (in micrometers) of innervation of TRKC+, NF160+ and RFP+ nerve fibers (processed from h) of E13.5 forelimb from TrkCCreER;R26tdTOM embryos injected with a low dose of 4-OHT (0.02 g/kg) at E11. The pattern and depth color code reveal similar territories (in all dimensions, xyz) of innervation of the TOM+ PSNs compared to all axons (NF160). Scale bar: 200 µm. j Scheme illustrating the preferential selection of TRKCHigh PSNs during the cell death period.
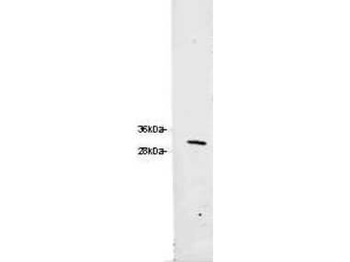
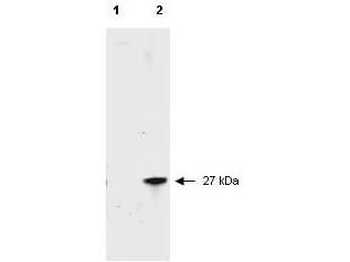
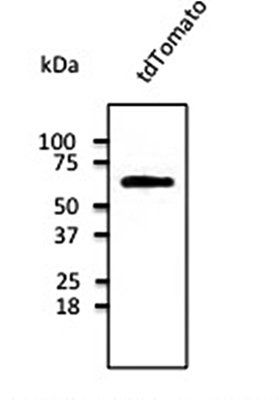
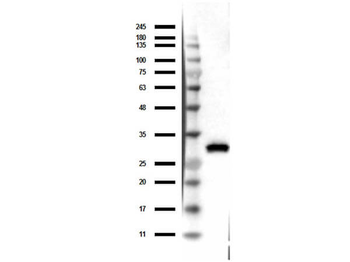
Western blot of Biorbyt's Chicken Anti-RFP Antibody. Loaded 0.1 µg of RFP protein (p/n orb345960) on a 4-20% gel and transferred to nitrocellulose membrane. Chicken anti-RFP Antibody was added at 1.0 µg/ml at RT for 2 hours. IRDye800® goat anti-Chicken was added at 1:20000 at RT for 45 minutes.
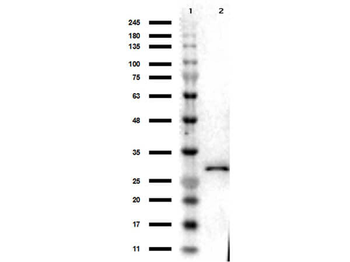
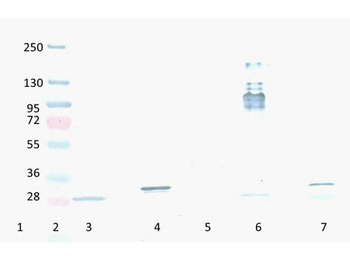
Western Blot Results of Chicken Anti-RFP Antibody. Lane 1: Opal PreStained Molecular Weight Marker. Lane 2: RFP (p/n orb345960), load 50 ng. Primary Antibody: Anti-RFP 1 µg/ml overnight at 4°C. Secondary Antibody: Goat Anti-Chicken HRP (p/n orb346892) at 1:40000 for 30 min at RT. Blocking: BlockOut (p/n orb348644) for 30 min at RT. Expect: 27kDa.
Quick Database Links
Gene Symbol
DsRed
UniProt
UniProt Details
− No UniProt data available
Documents Download
Datasheet
Product Information
Request a Document
Protocol Information
WB
Western Blot (IB, immunoblot)
ELISA
Enzyme-linked Immunosorbent Assay (EIA)
DsRed Antibody (orb345911)

- 0.0
Based on 0 reviews
Participating in our Biorbyt product reviews program enables you to support fellow scientists by sharing your firsthand experience with our products.
Login to Submit a ReviewAvailable Sizes
Select a size below
Free Secondary Antibody (20 ul)0/0
Please add an antibody product to your cart first.