You have no items in your shopping cart.
On Promotion
Category
Tested Applications
Predicted Reactivity
Conjugation
Biologically Active
Featured Product
Search results for: 'CD16'
Unconjugated
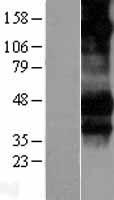
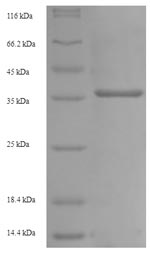
SDS-PAGE: Greater than 95% as determined by reducing SDS-PAGE.
Predicted: 21.9 KDa. Observed: 35-40 KDa, reducing conditions
Mouse
Leu32-Thr215
C-6His
10 μg, 50 μg, 500 μg, 1 mgUnconjugated
SDS-PAGE: Greater than 95% as determined by reducing SDS-PAGE.
Predicted: 22 KDa. Observed: 35-40 KDa, reducing conditions
Mouse
Ala31-Thr215
C-6His
10 μg, 50 μg, 500 μg, 1 mgUnconjugated
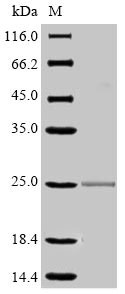
SDS-PAGE: Greater than 95% as determined by reducing SDS-PAGE.
Predicted: 21.9 KDa. Observed: 25-35 KDa, reducing conditions
Mouse
Gly21-Gln203
C-6His
10 μg, 50 μg, 500 μg, 1 mg- Item 1 of 1
32.64 kDa
Human
C-Myc/DDK
20 μg - Featured
 Item 1 of 2Featured
Greater than 95% as determined by SDS-PAGE.
20.8 kDa
Mammalian cell
Homo sapiens (Human)
17-200aa
Partial
C-terminal 10xHis-tagged
1 mg, 100 μg, 20 μg - FeaturedActive
 Item 1 of 2FeaturedActive
Greater than 95% as determined by SDS-PAGE.
22.7 kDa
Mammalian cell
Homo sapiens (Human)
17-208aa
Partial
C-terminal 6xHis-tagged
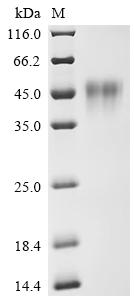
1 mg, 100 μg, 20 μg - FeaturedItem 1 of 2Featured
Greater than 95% as determined by SDS-PAGE.
26.5 kDa
Mammalian cell
Homo sapiens (Human)
17-208aa(V176F)
Partial
C-terminal 10xHis-avi-tagged
1 mg, 100 μg, 20 μg - FeaturedItem 1 of 1Mouse Fcgr3 protein [orb358359]Featured
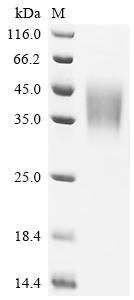
Greater than 90% as determined by SDS-PAGE.
37.2 kDa
E.coli
Mus musculus (Mouse)
31-215aa
Extracellular Domain
N-terminal 6xHis-SUMO-tagged
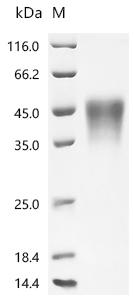
1 mg, 100 μg, 20 μg - FeaturedItem 1 of 1Mouse Fcgr3 protein [orb358914]Featured
Greater than 90% as determined by SDS-PAGE.
25.2 kDa
Mammalian cell
Mus musculus (Mouse)
31-215aa
Extracellular Domain
N-terminal 6xHis-Myc-tagged
100 μg, 20 μg, 1 mg 29.4 kDa
Human
C-Myc/DDK
20 μg