You have no items in your shopping cart.
On Promotion
Category
Species Host
Tested Applications
Reactivity
Predicted Reactivity
Conjugation
Biologically Active
Featured Product
Search results for: 'IL-1'
- Featured
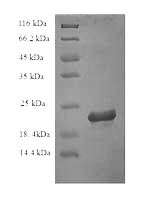
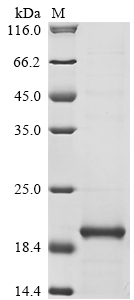
 Item 1 of 1Rat Il18 protein [orb54096]Featured
Greater than 90% as determined by SDS-PAGE.
22.3 kDa
E.coli
Rattus norvegicus (Rat)
37-194aa
Full Length of Mature Protein
N-terminal 6xHis-tagged
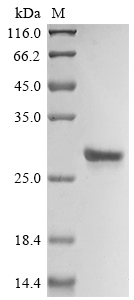
1 mg, 100 μg, 20 μg - FeaturedItem 1 of 1Mouse Il18 protein [orb604186]Featured
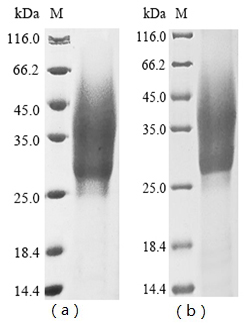
Greater than 85% as determined by SDS-PAGE.
26.1 kDa
E.coli
Mus musculus (Mouse)
1-192aa
Full Length
N-terminal 6xHis-tagged
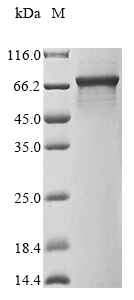
1 mg, 100 μg, 20 μg - FeaturedItem 1 of 1Mouse Irak3 protein [orb604198]Featured
Greater than 90% as determined by SDS-PAGE.
73.5 kDa
E.coli
Mus musculus (Mouse)
1-609aa
Full Length
N-terminal 10xHis-tagged and C-terminal Myc-tagged
1 mg, 100 μg, 20 μg - FeaturedItem 1 of 1Featured
Greater than 90% as determined by SDS-PAGE.
20 kDa
Yeast
Homo sapiens (Human)
113-271aa
Full Length of Mature Protein
N-terminal 6xHis-tagged
100 μg, 20 μg, 1 mg - FeaturedItem 1 of 1Featured
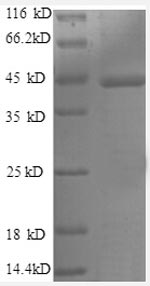
Greater than 90% as determined by SDS-PAGE.
43.8 kDa
E.coli
Homo sapiens (Human)
120-269aa
Partial
N-terminal GST-tagged
20 μg, 1 mg, 100 μg 
- FeaturedItem 1 of 1Human CASP1 Protein [orb1477022]Featured
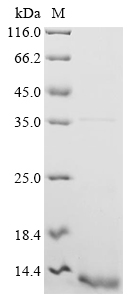
Greater than 85% as determined by SDS-PAGE.
11.4 kDa
E.coli
Homo sapiens (Human)
1-91aa
Partial
C-terminal HA-tagged
1 mg, 100 μg, 20 μg - FeaturedItem 1 of 1IL1A Protein [orb1477919]Featured
Greater than 85% as determined by SDS-PAGE.
21.9 kDa
Yeast
Macaca fascicularis (Crab-eating macaque) (Cynomolgus monkey)
113-271aa
Full Length of Mature Protein
C-terminal 6xHis-Myc-tagged
100 μg, 20 μg, 1 mg - FeaturedItem 1 of 1Human IL1B Protein [orb1478116]Featured
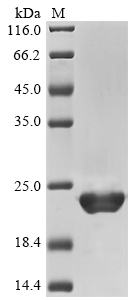
Greater than 90% as determined by SDS-PAGE.
21.5 kDa
E.coli
Homo sapiens (Human)
117-269aa
Partial
N-terminal 6xHis-tagged
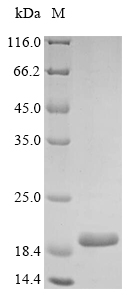
100 μg, 1 mg, 20 μg - FeaturedItem 1 of 1Human IL18 Protein [orb1478057]Featured
Greater than 90% as determined by SDS-PAGE.
19.7 kDa
E.coli
Homo sapiens (Human)
37-193aa
Full Length of Mature Protein
C-terminal 10xHis-tagged
1 mg, 100 μg, 20 μg