You have no items in your shopping cart.
Description
Images & Validation
−Item 1 of 6
| Tested Applications | ELISA, IHC, WB |
|---|---|
| Dilution Range | ELISA: 1:5,000 - 1:25,000, IHC: 1:250 - 1:1,500, WB: 1:500 - 1:3,000 |
| Application Notes |
Key Properties
−| Antibody Type | Primary Antibody |
|---|---|
| Host | Goat |
| Clonality | Polyclonal |
| Isotype | IgG |
| Immunogen | Fluorescein conjugated to Goat IgG |
| Purity | Fluorescein Antibody was prepared from monospecific antiserum by immunoaffinity chromatography using Fluorescein conjugated Goat IgG coupled to agarose beads followed by solid phase adsorption(s) to remove any unwanted reactivities. Assay by immunoelectrophoresis resulted in a single precipitin arc against anti-Goat Serum and Fluorescein conjugated Bovine Serum Albumin. |
| Conjugation | Unconjugated |
Storage & Handling
−| Storage | Store vial at 4° C prior to opening. Aliquot contents and freeze at -20° C or below for extended storage. Avoid cycles of freezing and thawing. Centrifuge product if not completely clear after standing at room temperature. This product is stable for several weeks at 4° C as an undiluted liquid. Dilute only prior to immediate use. |
|---|---|
| Form/Appearance | Liquid (sterile filtered) |
| Buffer/Preservatives | Preservative: 0.01% (w/v) Sodium Azide. Stabilizer: None; Buffer: 0.02 M Potassium Phosphate, 0.15 M Sodium Chloride, pH 7.2 |
| Concentration | 1.2 mg/mL |
| Expiration Date | 12 months from date of receipt. |
| Disclaimer | For research use only |
Alternative Names
−goat Anti FITC, goat anti Fluorescein
Similar Products
−- Item 1 of 6
- Item 1 of 6
Mouse Human IgA2 (subclass specific), conjugated with FITC Antibody [orb22234]
Human
Mouse
Monoclonal
FITC
0.2 mgMouse Human IgA1 (subclass specific), conjugated with FITC Antibody [orb22219]
Human
Mouse
Monoclonal
FITC
0.2 mg- Item 1 of 5

Quality Guarantee
Explore bioreagents carefree to elevate your research. All our products are rigorously tested for performance. If a product does not perform as described on its datasheet, our scientific support team will provide expert troubleshooting, a prompt replacement, or a refund. For full details, please see our Terms & Conditions and Buying Guide. Contact us at [email protected].

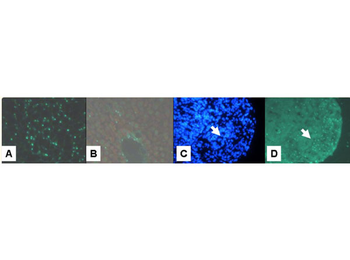
A–D. Y-chromsome labeling of control and experimental lesions. A. Male liver. Note high labeling of hepatocytes (70%). This is the expected frequency as some Y-chromosomes are not in the plane of the tissue section. B. Liver from female recipient of male bone marrow. Hepatocytes are not labeled, but many endothelial cells and Kupffer cells are. C, D Lung adenocarcinoma. C. DAPI; D. FISH. The tumor cells do label for Ychromosomes, whereas the stromal cells are heavily labeled. The arrows show the demarcation between the tumor and the stroma.

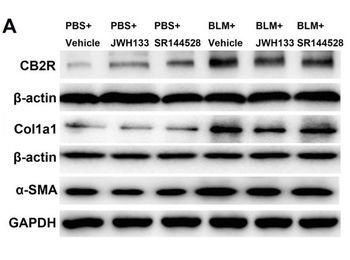
CB2R agonist JWH133 prevents bleomycin-induced collagen I expression in mice lung tissue. (A) The expression of cannabinoid receptor type 2 (CB2R), collagen I (Col1a1) and α-SMA (Acta2) were evaluated by western blotting.

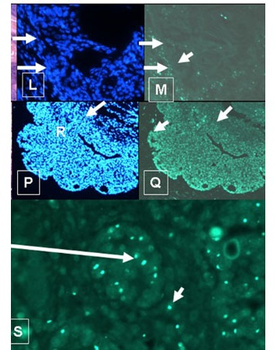
L–M. Squamous cell carcinoma from mouse 1; P–S. Breast cancer from mouse 4. L–M Squamous cell carcinoma from mouse 1. The squamous cell carcinoma in the breast of mouse 1 does not contain Y-Chromosomes, whereas the breast adenocarcinoma in mouse 4 (E–F) does. L. DAPI (nuclei), M. in situ for Y-chromosome (40X). The arrows mark the border between the squamous cell carcinoma and the stroma. P–S. Breast Cancer from mouse 4. P. DAPI showing nuclei in the tumor. Q. In situ for Y-chromosomes (20X) showing up to 80% of nuclei in tumor contain Y-chromosome in this section. The arrows in O-Q delineate the border of the stroma and the tumor. In contrast to M, Q shows that the tumor labels strongly for Y-chromosomes, whereas the stroma is weakly labeled. S in situ for Y-chromosome of breast adenocarcinoma (40X). The larger arrow shows a focus of cancer in the H&E section that is labeled for Y-chromosome in a serial section.

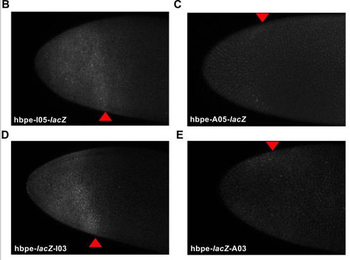
Self-cleaving ribozymes can tune gene expression in Drosophila embryos. (B-E) Representative images of in situ hybridized Drosophila embryos probed for lacZ. Each embryo imaged expresses lacZ under the control of the hbpe and contains an inactive (B/D) or active (C/E) ribozyme. Red triangles represent the width of the lacZ gradient.

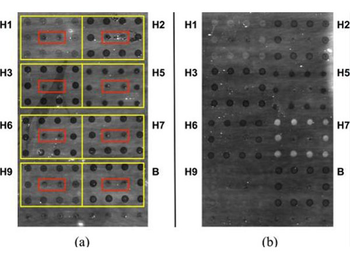
Strong responses to polyclonal anti-HA antiserum are readily observable on an AIR hemagglutinin microarray. (a) 1% BSA control. (b) Anti-H7 polyclonal antiserum (A/Netherlands/219/2003, H7N7), 1:80 dilution (1.3%) in 1% BSA. Spots showing substantially increased brightness indicate binding to immobilized H7. In both cases, antigens were arrayed in square patterns as indicated by the yellow boxes in (a); a mouse IgG Fc domain (p/n orb346280) was included as negative control (red boxes). Slight differences in spot intensity in the control (a) are due to differences in deposition efficiency for different antigens or controls. Specific antigens used in these experiments are indicated in Table 2. Goat anti-fluorescein, (p/n orb345272) used as an internal negative control.

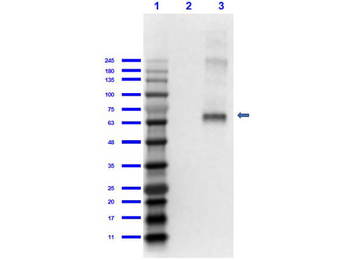
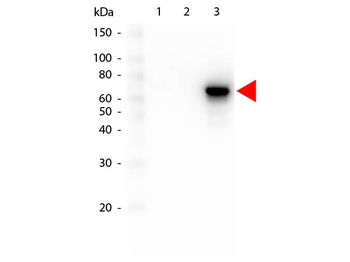
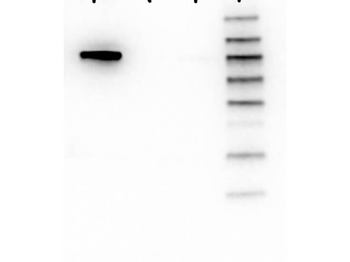
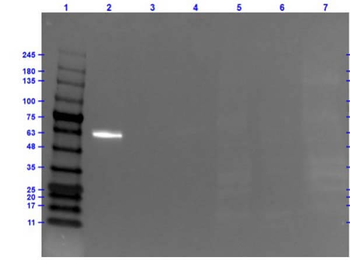
Western Blot of Goat Anti-Fluorescein Antibody. Lane 1: Opal Prestained Molecular Weight Marker. Lane 2: Bovine Albumin (BSA) (p/n orb2652777) [0.05 µg]. Lane 3: Bovine Albumin-Fluorescein (BSA-FITC) [0.05 µg]. Primary Antibody: Gt-anti-Fluorescein 1.0 µg/ml overnight at 2-8°C. Secondary Antibody: Donkey Anti-Goat HRP (p/n orb347031) at 1:40000 for 30 mins at RT. Block: 5% BLOTTO (p/n orb348624) in 1X PBS for 1hr at RT. Predicted MW: ~60kDa. Observed MW: ~65kDa. Exposure: 1sec.
Documents Download
Datasheet
Product Information
Request a Document
Protocol Information
WB
Western Blot (IB, immunoblot)
IHC
Immunohistochemistry
ELISA
Enzyme-linked Immunosorbent Assay (EIA)
Fluorescein (FITC) Antibody (orb345272)

- 0.0
Based on 0 reviews
Participating in our Biorbyt product reviews program enables you to support fellow scientists by sharing your firsthand experience with our products.
Login to Submit a ReviewAvailable Sizes
Select a size below
Free Secondary Antibody (20 ul)0/0
Please add an antibody product to your cart first.