You have no items in your shopping cart.
On Promotion
Category
Tested Applications
Conjugation
Featured Product
Search results for: 'CD3'
- Featured
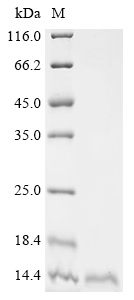
 Item 1 of 1Human CD3E protein [orb383281]Featured
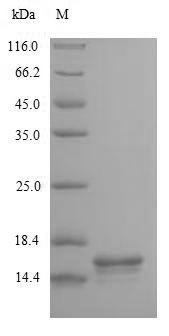
Greater than 90% as determined by SDS-PAGE.
13.8 kDa
Yeast
20 μg, 1 mg, 100 μg - FeaturedItem 1 of 1Featured
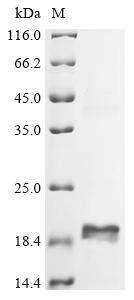
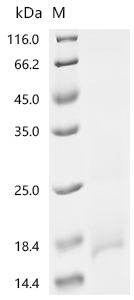
Greater than 90% as determined by SDS-PAGE.
18.2 kDa
E.coli
100 μg, 1 mg, 20 μg - FeaturedItem 1 of 1Featured
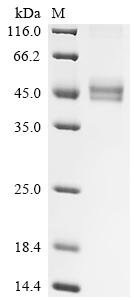
Greater than 90% as determined by SDS-PAGE.
39.6 kDa
Mammalian cell
20 μg, 1 mg, 100 μg - FeaturedItem 1 of 1Featured
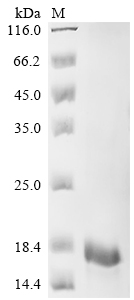
Greater than 90% as determined by SDS-PAGE.
15.2 kDa
E.coli
1 mg, 100 μg, 20 μg - FeaturedItem 1 of 1Featured
Greater than 90% as determined by SDS-PAGE.
13.0 kDa
E.coli
1 mg, 100 μg, 20 μg - FeaturedItem 1 of 1Featured
Greater than 90% as determined by SDS-PAGE.
13.5 kDa
E.coli
1 mg, 100 μg, 20 μg