You have no items in your shopping cart.
Tbs Fish Gel Concentrate 10X
SKU: orb348589
Description
Images & Validation
−Item 1 of 2
| Application Notes |
|---|
Key Properties
−| Purity | This product was aseptically filtered through a Millipore 0.22 micron filter into clean, pre-sterilized containers. The product was tested on trypticase soy agar for 24 hours, 48 hours and 72 hours and was found to be negative for bacteria. |
|---|---|
| Conjugation | Unconjugated |
Storage & Handling
−| Storage | Store container at 4° C before opening. Protect from moisture and light. No special shipping conditions or precautions are required. |
|---|---|
| Form/Appearance | Liquid (sterile filtered) |
| Buffer/Preservatives | Buffer: See application note. |
| Concentration | 10X |
| Expiration Date | 12 months from date of receipt. |
| Hazard Information | Non-Toxic |
| Disclaimer | For research use only |
Alternative Names
−10X TBS Fish Gel Concentrate (Azide and Mercury free), 10X TBS Solution, 10X Fish Gel Solution
Similar Products
−Quality Guarantee
Explore bioreagents carefree to elevate your research. All our products are rigorously tested for performance. If a product does not perform as described on its datasheet, our scientific support team will provide expert troubleshooting, a prompt replacement, or a refund. For full details, please see our Terms & Conditions and Buying Guide. Contact us at [email protected].
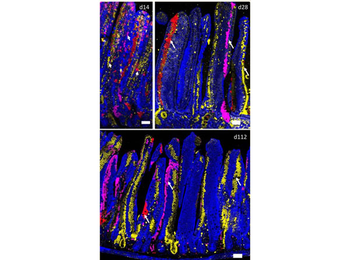
LGR5-rainbow lineage tracing. LBOW mice were crossed to ROSA-CreER/T2 mice and intraperitoneally injected with 200 mg/kg tamoxifen every other day for a total of three injections. Mice (n = 4–6/time point) were chased for 14, 28, 56, 112, 224, or 365 days. The small intestine was harvested, sectioned with a Vibratome, fixed and permeabilized in FISHX comprising fish gelatin extract (p/n orb348589) and 0.2% Triton-X-100 for 30 min, stained for EYFP and mCherry/E2-Crimson (p/n orb345391), and processed. ections from each mouse intestine were tile-imaged by confocal microscopy. A subset of each tiled imaged that is representative for days 14 (d14), 28 (d28), and 112 (d112) is presented. (mKO1, blue; EYFP, yellow; mCherry, red; E2-Crimson, magenta) (scale bars, 50 µm). Small arrows depict small patches of clones, whereas large arrows depict full-length large clones.
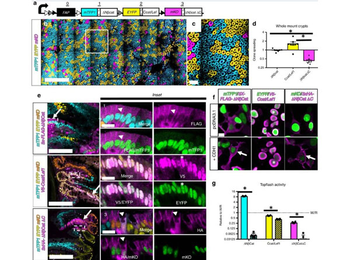
Widespread expansion of oncogenic clones during perinatal development. a Diagram of MCAT-Crainbow mice. b MCATVilCre small intestine (N = 10 mice, 3–6 weeks of age) prepared as a wholemount and confocal imaged. c Inset in "b" at higher magnification. d MCATVilCre Crypts were color segmented, counted and normalized to the positional bias calculated in NCATVilCre mice. Asterisk denotes statistical significance by one-way ANOVA (mTFP1 vs. EYFP: p = 0.003, mTFP1 vs. mKO: p = 0.016, EYFP vs. mKO = 3e–6). e Immunostaining for FLAG, V5, or HA epitopes (magenta) specific to each ßcat isoform in MCATVilCre small intestine vibratome slices and merged with fluorescent lineage markers (mTFP1: cyan, EYFP: yellow, and mKO: orange). Arrows denote isoform expression with cognate lineage reporter (FLAG and mTFP1, V5 and EYFP, and HA and mKO). Corresponding insets depict higher magnification images. Arrowheads denote membrane-localized ßcat, whereas asterisk denotes nuclear-localized ßcat. Epitope stains (magenta) are also presented as merged and as a single-channel image with its cognate fluorescent lineage reporter (green). f HEK cells were transiently transfected with MCAT isoforms, fixed, stained, and imaged for the indicated epitope (magenta) and fluorescent reporter (green). Cells were also cotransfected with epithelial cadherin (CDH1) as indicated. Arrows denote sequestration of ßcat at the plasma membrane, and the asterisk denotes nuclear ßcat. g Wnt signalling activity for each oncogene in the absence of CDH1 (solid bar) or in the presence of overexpressed CDH1 (hatched bar) (N = 6 wells per condition and independently repeated in four experiments). TOP FLASH activity was normalized to WNT/RSPO-stimulated control cells (dashed line). Asterisk denotes statistical significance by two-way ANOVA and Bonferroni's multiple comparisons test (cyan < 1e–6, yellow = 0.01, magenta = 0.02). (SEM included for each graph). Scale Bars = 1 mm in b, 100 µm in c/e, 15 µm in e: insets 1–3, and 10 µm in f. Cells were fixed at room temperature for 15 min in 4% PFA, washed once with PBS, and permeabilized/blocked in FISHX (0.25% Triton-X diluted in 1% Fish Gelatin (p/n orb348589)) for 20 min at room temperature.
Documents Download
Datasheet
Product Information
Request a Document
Tbs Fish Gel Concentrate 10X (orb348589)

- 0.0
Based on 0 reviews
Participating in our Biorbyt product reviews program enables you to support fellow scientists by sharing your firsthand experience with our products.
Login to Submit a ReviewAvailable Sizes
Select a size below