You have no items in your shopping cart.
On Promotion
Category
Tested Applications
Reactivity
Predicted Reactivity
Conjugation
Biologically Active
Featured Product
Search results for: 'IGF'
- Featured
 Item 1 of 1Featured
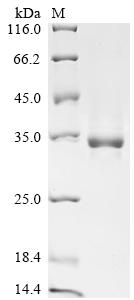
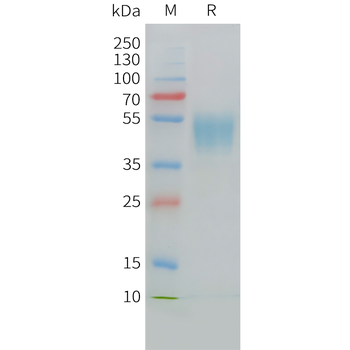
Greater than 85% as determined by SDS-PAGE.
34.3 kDa
Yeast
Bos taurus (Bovine)
50-119aa
Full Length of Mature Protein
N-terminal hFc-tagged
100 μg, 20 μg, 1 mg - FeaturedItem 1 of 1Featured
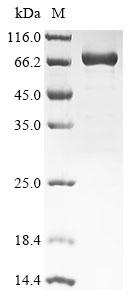
Greater than 85% as determined by SDS-PAGE.
69.7 kDa
E.coli
Homo sapiens (Human)
1-579aa
Full Length
N-terminal 6xHis-tagged
1 mg, 100 μg, 20 μg - FeaturedItem 1 of 1Featured
Unconjugated
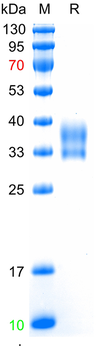
Greater than 95% as determined by reducing SDS-PAGE.
26.1 KDa
Mammalian
Not available
C-6×His Tag
10 μg, 50 μg - FeaturedItem 1 of 1Human LongIGF-II Protein [orb1471741]Featured
Unconjugated
Greater than 95% as determined by reducing SDS-PAGE.
8.91 KDa
Mammalian
Not available
C-10×His tag
10 μg, 50 μg - FeaturedItem 1 of 1Human LR3-IGF-1 Protein [orb1471762]Featured
Unconjugated
Greater than 95% as determined by reducing SDS-PAGE.
9.1 KDa
Mammalian
Not available
C-Human Fc tag
10 μg, 50 μg - FeaturedItem 1 of 1Featured
>90% as determined by SDS-PAGE
24.6 kDa
Human
C-His
100 μg, 500 μg, 20 μg - FeaturedItem 1 of 1Featured
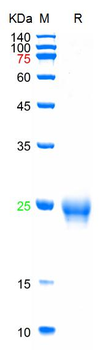
>95% as determined by SDS-PAGE
34 kDa
C-His
100 μg, 500 μg, 20 μg - FeaturedItem 1 of 1Featured
>90% as determined by SDS-PAGE
25 kDa
Trx & His
100 μg, 500 μg - FeaturedItem 1 of 1Featured
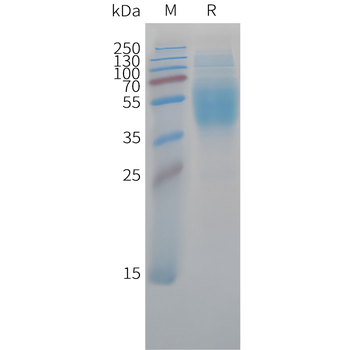
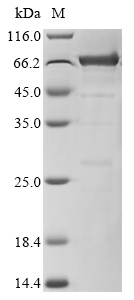
Greater than 85% as determined by SDS-PAGE.
67.2 kDa
E.coli
Homo sapiens (Human)
763-931aa
Partial
N-terminal MBP-tagged and C-terminal 6xHis-Avi-tagged
1 mg, 100 μg, 20 μg - FeaturedItem 1 of 1Featured
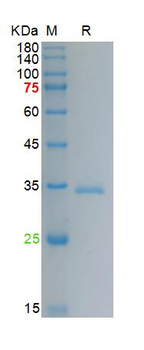
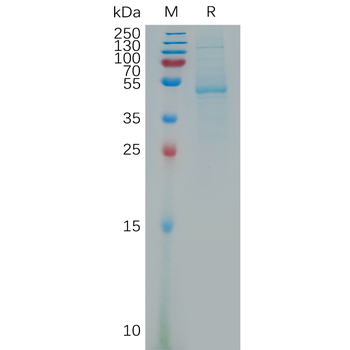
Unconjugated
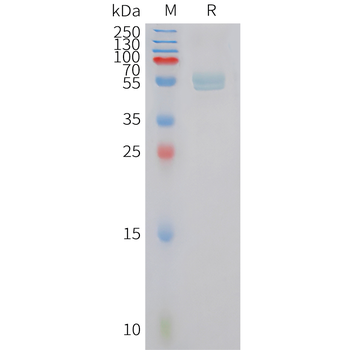
The purity of the protein is greater than 95% as determined by SDS-PAGE and Coomassie blue staining.
The protein has a predicted molecular mass of 33.8 kDa after removal of the signal peptide. The apparent molecular mass of hFc-IGF1 is approximately 35-55 kDa due to glycosylation.
Mammalian
hFc(Glu99-Ala330) IGF1(Gly49-Ala118)
N-Human Fc Tag
10 μg, 50 μg, 100 μg