You have no items in your shopping cart.
Description
Research Area
Protein Biochemistry
Images & Validation
−Item 1 of 6
| Tested Applications | SDS-PAGE |
|---|---|
| Application Notes |
Key Properties
−| Source | Mouse |
|---|---|
| Biological Origin | Mouse |
| Isotype | IgG |
| Conjugation | Unconjugated |
| Purity | Mouse IgG was prepared from normal mouse serum by a multi-step process which includes delipidation, salt fractionation and ion exchange chromatography followed by extensive dialysis against the buffer stated above. Assay by immunoelectrophoresis resulted in a single precipitin arc against anti-Mouse IgG and anti-Mouse Serum. |
Storage & Handling
−| Storage | Store purified Mouse IgG at 4° C prior to restoration. For extended storage aliquot contents and freeze at -20° C or below. Avoid cycles of freezing and thawing. Centrifuge product if not completely clear after standing at room temperature. This product is stable for several weeks at 4° C as an undiluted liquid. Dilute only prior to immediate use. |
|---|---|
| Form/Appearance | Lyophilized |
| Buffer/Preservatives | Preservative: 0.01% (w/v) Sodium Azide. Stabilizer: None; Buffer: 0.02 M Potassium Phosphate, 0.15 M Sodium Chloride, pH 7.2 |
| Concentration | 10.0 mg/mL |
| Expiration Date | 6 months from date of receipt. |
| Disclaimer | For research use only |
Alternative Names
−Immunoglobulin G from Mouse, IgG from Mouse, purified polyclonal IgG antibody
Similar Products
−- Item 1 of 23
Multi-rAb Polymer HRP-Goat Rabbit Recombinant Secondary Antibody (H+L) [orb2302681]
IHC
Rabbit
Goat
Recombinant
HRP
3 x 5 ml, 5 ml, 10 x 5 ml - Item 1 of 11
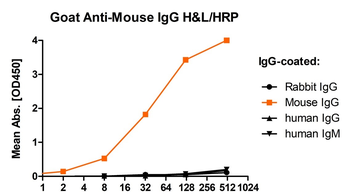
Goat Anti-Mouse IgG H&L, HRP conjugated [orb868932]
ELISA, IHC-Fr, IHC-P, WB
Mouse
Goat
Polyclonal
HRP
100 μl, 1 ml - Item 1 of 13
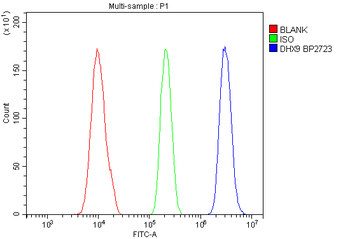
RNA Helicase A/DHX9 Rabbit Polyclonal Antibody [orb654322]
ELISA, FC, ICC, IF, IHC, IP, WB
Human, Mouse, Rat
Rabbit
Polyclonal
Unconjugated
100 μg - Item 1 of 11
Goat Anti-Mouse IgG H&L, Biotin conjugated [orb868227]
ELISA, FC, ICC, IF, IHC-Fr, IHC-P, WB
Mouse
Goat
Polyclonal
Biotin
100 μl, 1 ml - Item 1 of 10
F(ab')₂ Fragment Goat Anti-Mouse IgG H&L, Biotin conjugated [orb1974591]
ELISA, FC, ICC, IF, IHC-Fr, IHC-P, WB
Mouse
Goat
Polyclonal
Biotin
100 μl
Quality Guarantee
Explore bioreagents carefree to elevate your research. All our products are rigorously tested for performance. If a product does not perform as described on its datasheet, our scientific support team will provide expert troubleshooting, a prompt replacement, or a refund. For full details, please see our Terms & Conditions and Buying Guide. Contact us at [email protected].
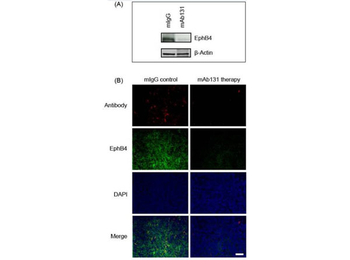
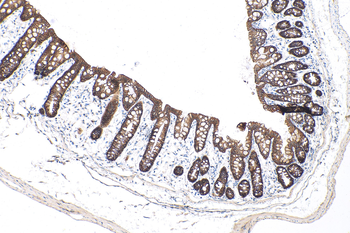
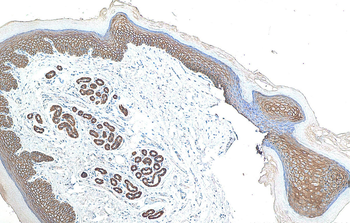
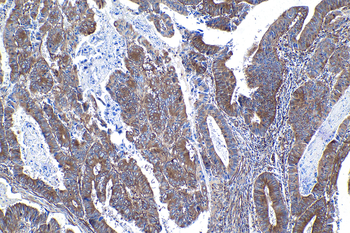
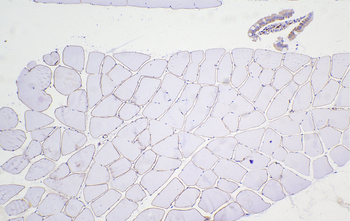
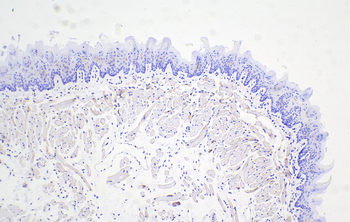
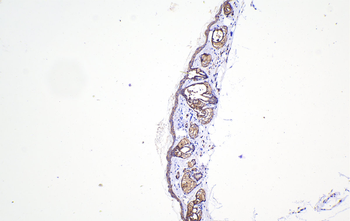
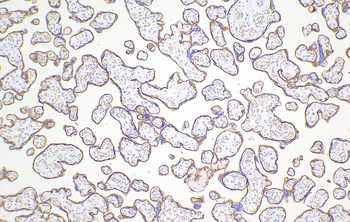
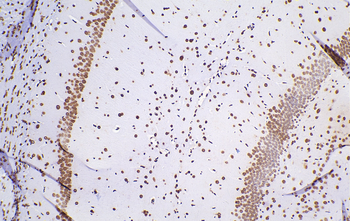
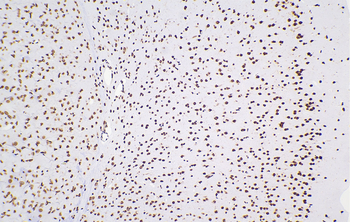
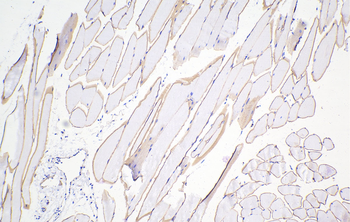
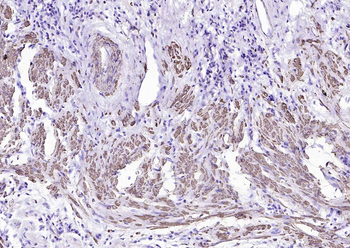
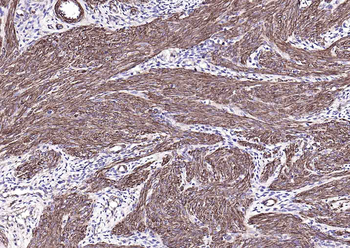
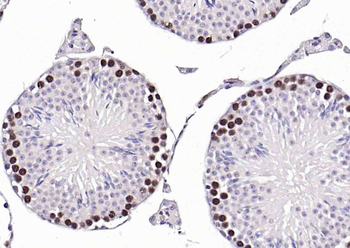
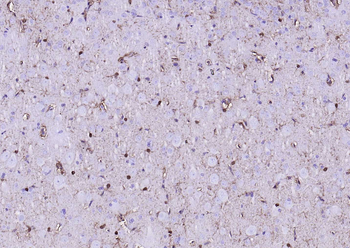
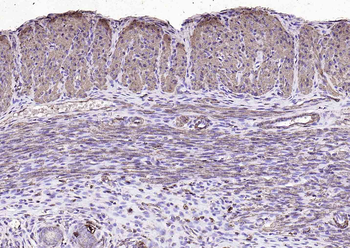
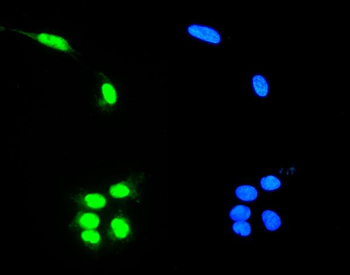
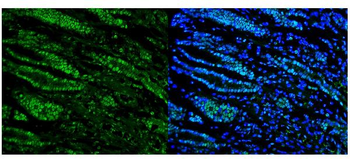
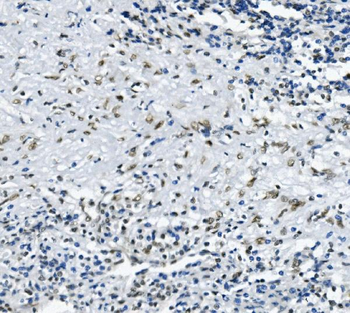
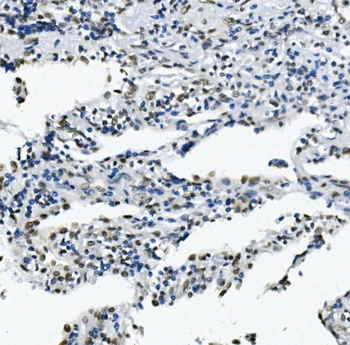
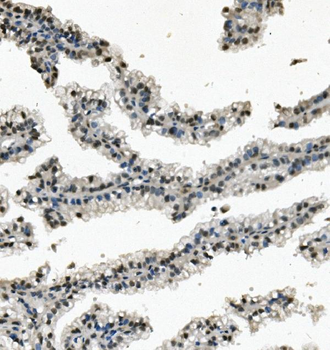
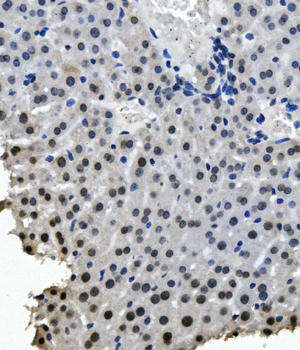
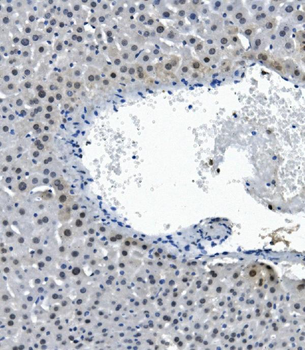
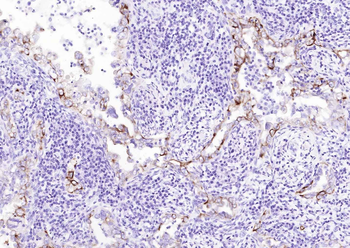
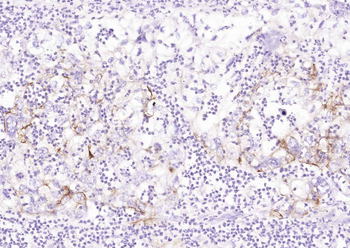
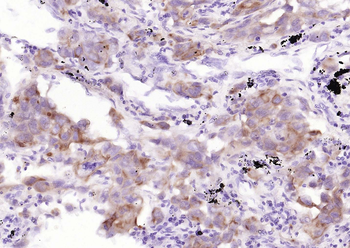
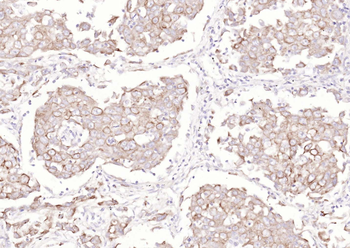
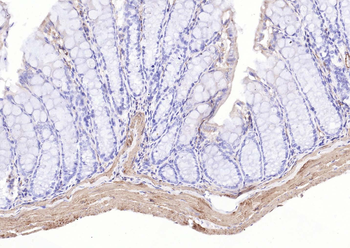
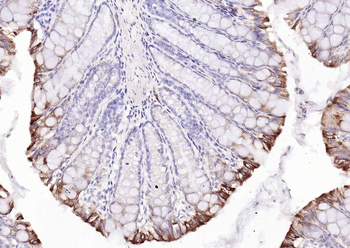
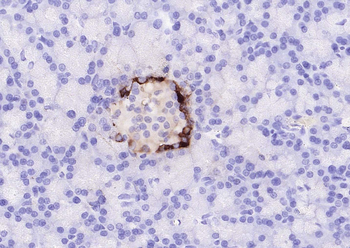
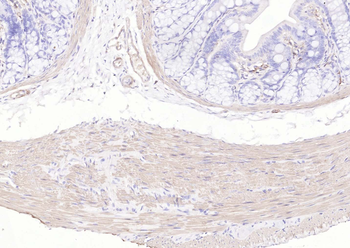
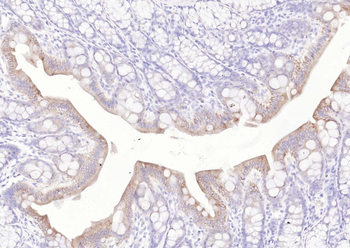
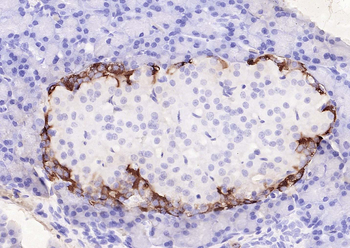
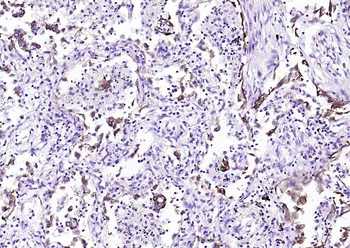
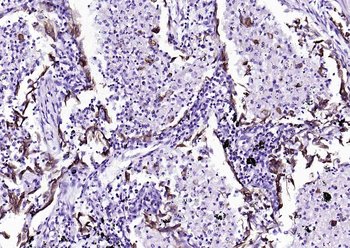
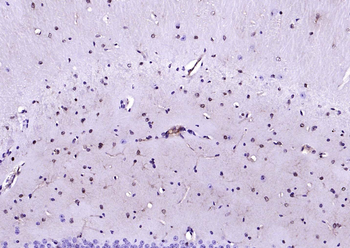
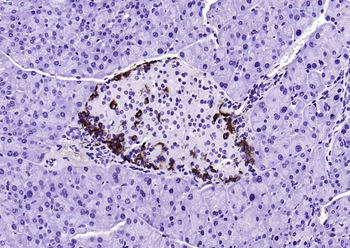
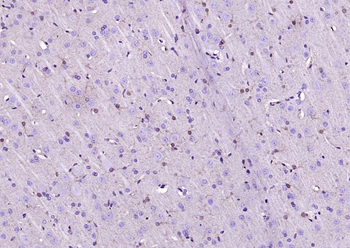
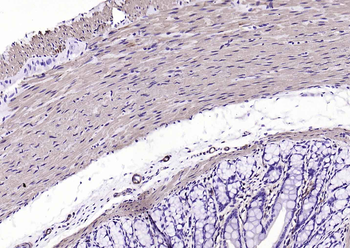
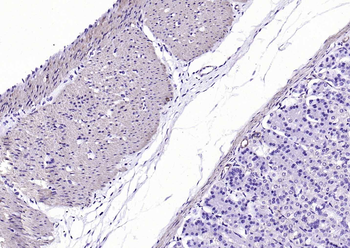
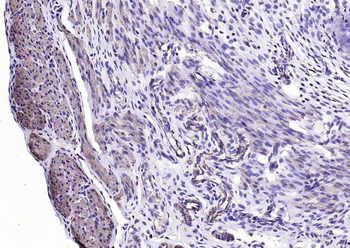
(A) Western blot analysis of EphB4 level in HT29 tumor tissues after mAb131 or mIgG (control) treatment. (B) Antibody and EphB4 co-staining on tumor sections of mAb131 or mIgG (control)-treated HT29 tumor-bearing mice 48 h p.i. of hAb47-Cy5.5. Scale bar, 20 µm. Mouse IgG (mIgG) (p/n orb2652749).
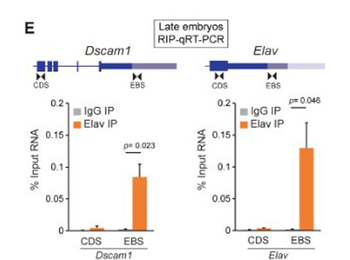
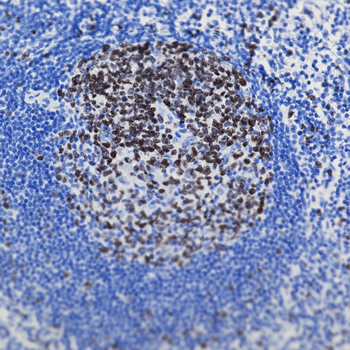
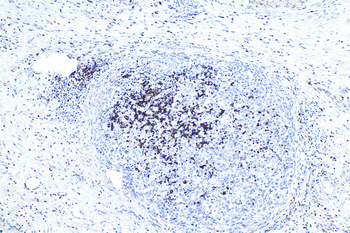
Elav Regulates Dscam1 Long 3' UTR Biogenesis. (E) RIP-qRT-PCR experiments demonstrate binding of Elav downstream of the Dscam1 proximal polyA site (left), and as a positive control, binding of Elav downstream of the Elav proximal polyA site (right). RIP was performed using rat and mouse anti-Elav antibodies from 12–16 h embryos. Primers were designed to detect a region in the CDS or a region immediately downstream of the proximal polyA site (EBS). Error bars represent SEM of four separate immunoprecipitation reactions on independently prepared nuclei. n = 4. p value reflects two-tailed paired Student's t test. Samples were incubated with a mixture of 1 µg rat and 1 µg mouse anti-Elav antibodies or a mixture of 1 µg rat and 1 µg mouse IgG,

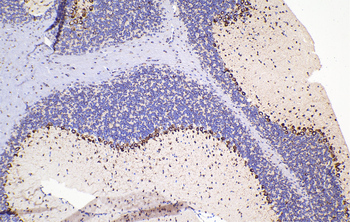
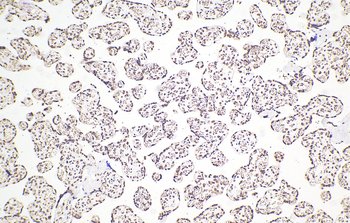
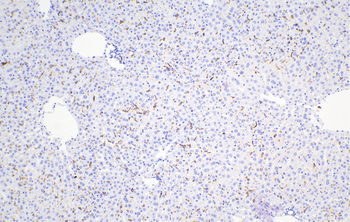
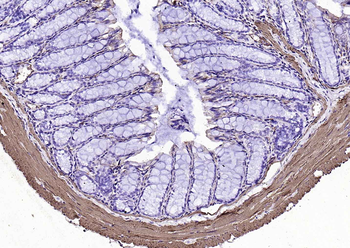
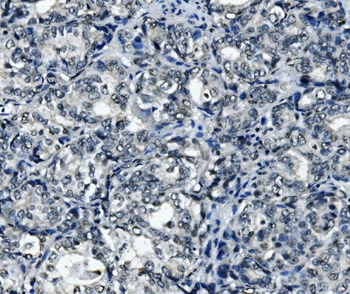
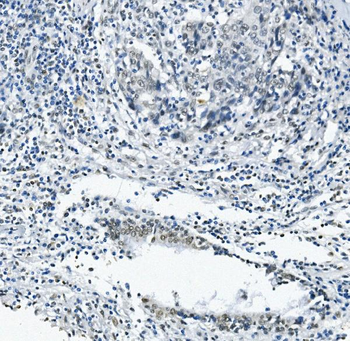
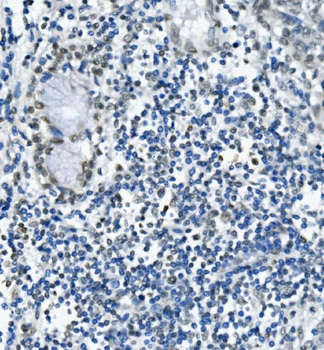
Epitope-targeting space of top expanded clones. Epitope binning following a classical sandwich protocol: loading of capture antibody, quenching of biosensors in polyclonal mouse IgG (p/n orb2652749), loading of capture antibody, loading of OVA, loading of probe antibody. (A) Heatmaps show competitive antigen binding based on BLI assays for highly expanded antibody clones in each mouse. Antibodies indicated on the left were captured and probe antibodies on top were used to determine cross-competition for epitope access. Red indicates no binding of the probe antibody as a consequence of epitope blocking by the capture antibody, whereas green denotes binding of the competitor antibody. Groups of antibodies that target the same epitope (epitope bins) are highlighted in white squares. Brackets indicate clonal variants that share the same VH/VL germline V-genes which differed only in CDRH3/CDRL3 aa sequence. An anti-RSVF capture antibody, which does not bind the antigen was used as negative control for all experiments. Clone ID according to SI Appendix, Table S1. (B) Epitope bins with associated clones as determined in (A). Nodes are connected based on observed direct cross-competition. (C) Epitope bins as defined by the cross-competition of clones from different mice. Representative V-gene combinations are shown on the right. Nodes are connected based on direct cross-competition and sizes indicate clone size (number of cells per clone). Colors represent mouse ID as shown in (B). Results are reflective of SI Appendix, Fig. S19. (D) CDRH3/CDRL3 sequence alignment of bin-specific clones. Sequence logo is shown on top and aa residues are highlighted if they are in disagreement with the consensus sequence. (E) Mapping of epitope space as determined in (C) on a sequence similarity network of all IgG clones across all mice (SI Appendix, Fig. S12). Edges represent clones with similar CDR3 sequences based on first calculating separate distance matrices for CDRH3 and CDRL3 amino acid sequences. Following the summation of these two matrices, edges were drawn between those clones separated by 700 mapped reads are shown for MS-1 and MS-2 and clone 5.14 of MS-5; for clones 5.12 and 5.29, only data points with > 18 mapped reads are shown. Shared data point between 5.12 and 5.29 is indicated with a circle. Corresponding V-gene combinations are indicated. (H) Mapping of epitope bins from (C) on to the OVA crystal structure using antibody epitope information obtained in (G) (PDB: 1OVA). Epitope binning following a classical sandwich protocol: loading of capture antibody, quenching of biosensors in polyclonal mouse IgG (p/n orb2652749), loading of capture antibody, loading of OVA, loading of probe antibody.
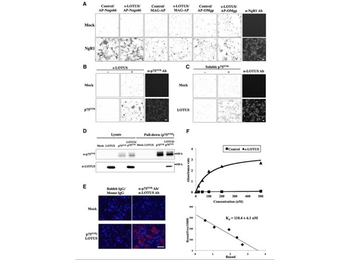
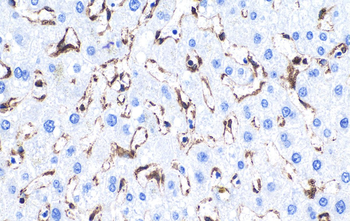
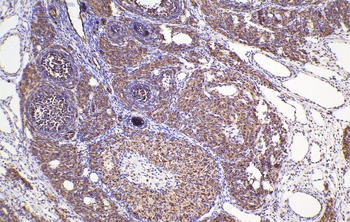
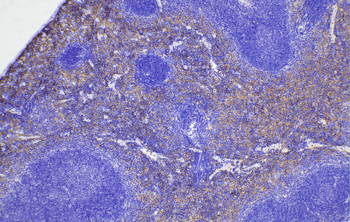
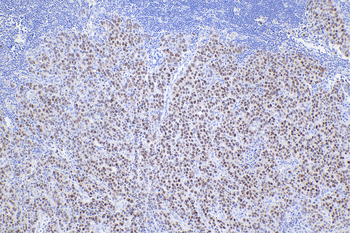
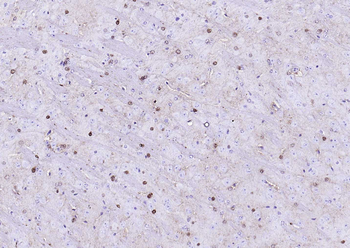
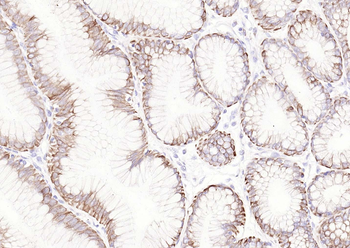
LOTUS binds to p75NTR. A, Binding assay in NgR1-overexpressing Cos-7 cells sequentially treated with s-LOTUS and MAIs. After SBP-Fc-LOTUS (0.1–1 µm) or SBP-Fc (control) was applied to NgR1-overexpressing Cos-7 cells and followed by 6His-AP-tagged MAIs (6His-AP-Nogo66, 3 nm; MAG-AP-6His, 20 nm; 6His-AP-OMgp, 50 nm), each MAI was detected with AP substrate. Scale bar, 100 µm. B, Binding assay in p75NTR-overexpressing Cos-7 cells treated with s-LOTUS. SBP-Fc-LOTUS or its vehicle was applied and detected by immunostaining with an anti-SBP-tag antibody. Scale bar, 100 µm. C, Binding assay in LOTUS-overexpressing Cos-7 cells treated with soluble p75NTR. p75NTR-Fc-SBP or its vehicle was applied and detected in the same way as in B. Scale bar, 100 µm. D, Pull-down assay in p75NTR and LOTUS co-overexpressing Cos-7 cells. GST-p75NTR and SBP-FLAG-LOTUS were co-overexpressed and the cell lysate was incubated with glutathione Sepharose beads. SBP-FLAG-LOTUS and GST-p75NTR were detected by Western blotting using an anti-SBP-tag antibody and an anti-GST antibody, respectively. E, Representative images of PLA signals (red) after treatment with primary antibodies before fixation in Cos-7 cells overexpressing both GST-p75 and SBP-FLAG-LOTUS. Red signals represent the close colocalization and interaction between LOTUS and p75NTR on the cell membrane surface. Cells were costained with DAPI (blue). Scale bar, 50 µm. F, Binding affinity of LOTUS for p75NTR examined by ELISA using SBP-Fc-p75NTR and LOTUS-Fc-6His or Fc-6His (control). Scatchard plot shows Kd = 110.4 ± 6.1 nm. The data were obtained from four independent experiments. Control Mouse IgG (p/n orb2652749).
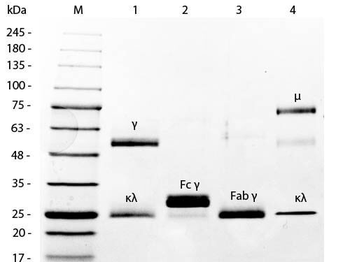
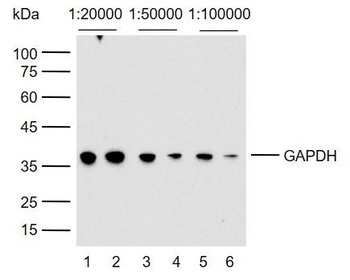
SDS-PAGE of Mouse IgG Whole Molecule Rhodamine Conjugated (p/n orb346272). MW: 5 µl Opal Prestained Marker. Lane 1: Reduced Mouse IgG Whole Molecule Rhodamine Conjugated (p/n orb346272). Lane 2: Reduced Mouse F(c) Fragment (p/n orb346280). Lane 3: Reduced Mouse F(ab) Fragment (p/n orb346282). Lane 4: Mouse IgM Kappa Myeloma Protein. Load: 1 µg per lane. Predicted/Observed size: IgG at 50 and 25 kDa; F(c) at 25 kDa; F(ab) at 25 kDa; IgM K at 70 and 23 kDa. Observed F(c) Fragment migrates slightly higher.
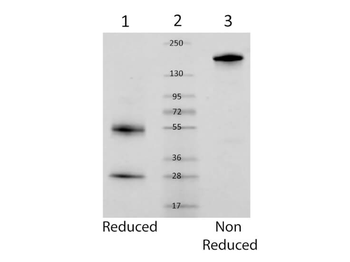
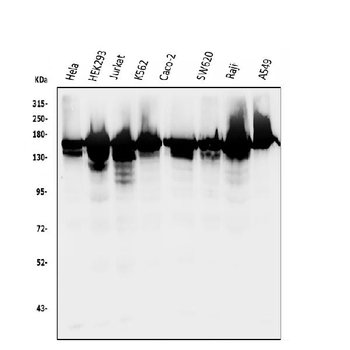
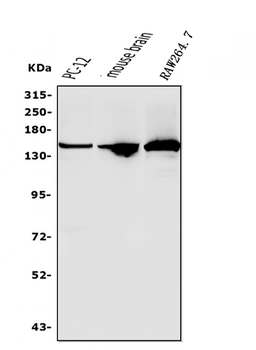
SDS-Page of Mouse IgG whole molecule. Lane 1: Mouse IgG reduced. Lane 2: Molecular Weight Marker. Lane 3: Mouse IgG non-reduced. Load: 1 µg per lane. Predicted/Observed size (non-reduced): 160 kDa, 160 kDa. Predicted/Observed size (reduced): 55 and 28 kDa, 55 and 28 kDa.
Documents Download
Datasheet
Product Information
Request a Document
Protocol Information
Protein Handling and Storage Guide
Protein Handling Guide
SDS-PAGE
Sodium Dodecyl Sulphate PolyAcrylamide Gel Electrophoresis
Mouse IgG (orb2652749)

- 0.0
Based on 0 reviews
Participating in our Biorbyt product reviews program enables you to support fellow scientists by sharing your firsthand experience with our products.
Login to Submit a Review