You have no items in your shopping cart.
Cart summary
Item 1 of 3
Item 1 of 3

| Catalog Number | orb345943 |
|---|---|
| Category | Assays and Kits |
| Description | HRP Western Blot Mouse IgG antibody (Peroxidase) |
| Clonality | Polyclonal |
| Species/Host | Goat |
| Conjugation | HRP |
| Concentration | 1.0 mg/ml |
| Buffer/Preservatives | 0.02 M Potassium Phosphate, 0.15 M Sodium Chloride, pH 7.2 |
| Tested applications | ELISA, IHC, WB |
| Dilution range | ELISA: 1:10,000-1:100,000, IHC: 1:500-1:5,000, WB: 1:5,000-1:40,000 |
| Application notes | Western Blot Analysis |
| Storage | See kit insert for complete instructions. |
| Alternative names | Anti-mouse IgG HRP conjugated, HRP-linked Antibody Read more... |
| Note | For research use only |
Ma, Lin et al. Baicalein Protects Rats with Diabetic Cardiomyopathy Against Oxidative Stress and Inflammation Injury via Phosphatidylinositol 3-Kinase (PI3K)/AKT Pathway Med Sci Monit, 24, 5368-5375 (2018)
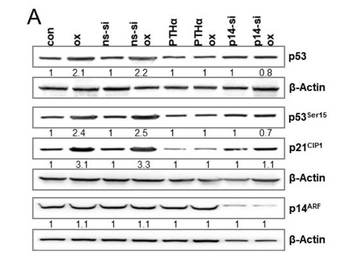
(A) LoVo cells were either exposed to PTHα (30 µm) or transfected with non-specific siRNA (ns-siRNA) or p14ARF specific siRNA. Cells were treated with 2.5 µm oxaliplatin 8 h after siRNA or 1 h after PTHα treatment. 120 h upon oxaliplatin exposure, the expression of p14ARF, p21CIP1, and p53, as well as the phosphorylation of p53 at Ser15 was measured by immunodetection. HRP conjugated goat anti-mouse (p/n orb345943) and HRP conjugated goat anti-rabbit (p/n orb345944) were used.
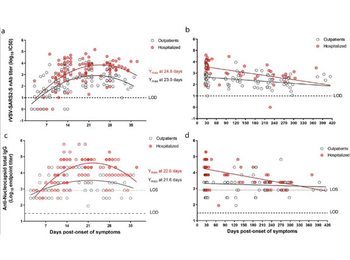
Longitudinal dynamics of neutralizing and anti-N antibody responses to SARS-CoV-2 infection from outpatient and hospitalized individuals. a, b. The half-maximum inhibitory concentration (IC50) of sera was determined by microneutralization assay of recombinant vesicular stomatitis virus carrying SARS-CoV-2 spike protein (rVSV-SARS2-S). a. Neutralizing antibody (nAb) titres (log10 IC50) from n = 30 outpatients (116 samples; grey circles) and n = 35 hospitalized (112 samples; red circles) at 2 to 37 days post-symptom onset. c. Longitudinal nAb titres (log10 IC50) from n = 36 outpatients (85 samples) and n = 31 hospitalized (58 samples) taken from day 23 (outpatients) or day 25 (hospitalized) until day 414 post-symptom onset. c, d. The end-point titres of anti-N IgG were determined by ELISA using a recombinant SARS-CoV-2 nucleocapsid protein. Samples and time points are the same as those in A and B. a-c. The second order polynomial (quadratic) curve fitting was used to establish the days at which peak titres occurred (Ymax). b–d. Continuous decay fit is shown with the red and gray line for the corresponding patient group. Every data point represents results from two technical replicates. HRP conjugated goat anti-mouse (p/n orb345943) was used at 1:3000.
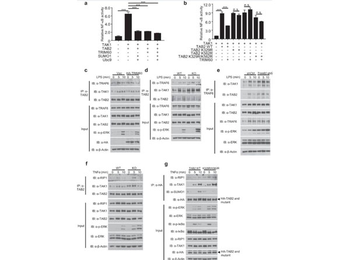
SUMOylation of TAB2 inhibits NF-κB activation by suppressing the TRAF6/TAB2/TAK1 complex. a Dual luciferase assay analysis of the effects of TRIM60-mediated SUMOylation on TAK1/TAB2-induced NF-κB activity. HEK293T cells were transiently transfected with the indicated plasmids, and the dual luciferase assay was performed. b Dual luciferase assay analysis of the effects of TAB2 mutants on the TRIM60-mediated suppression of NF-κB activity. c IP and WB analyses of the TRAF6/TAB2/TAK1 complex in control and HA-TRIM60-overexpressing RAW cells stimulated by LPS as indicated. Formation of the TRAF6/TAB2/TAK1 complex was examined in BMDMs (d) and RAW cells (e). Cells were stimulated with LPS for the indicated amounts of time, and IP and WB analyses were performed. f TRIM60 suppresses RIP1/TAB2/TAK1 signalosome formation in MEFs. IP and WB analyses of the RIP1/TAB2/TAK1 complex in MEFs. WT and TRIM60 KO MEFs were stimulated with TNFα as indicated, followed by IP and WB analyses. g IP and WB analyses of MAPK/NF-κB signaling activation and RIP1/TAB2/TAK1 complex formation. TAB2-deficient MEFs rescued with WT or TAB2-K329R/K562R were stimulated with TNFα as indicated, followed by IP and WB analyses to detect RIP1/TAB2/TAK1 complex formation, TAB2 SUMOylation, and phosphorylation of ERK and IκBα. The formation of the TRAF6/TAB2/TAK1 complex in c and d are quantified by ImageJ and shown as Supplementary Fig. 8a and b, respectively. The firefly luciferase activity levels in a and b were normalized to the Renilla luciferase activity levels and are presented as the mean ± SEM. ***P < 0.001; n.s. no significance (one-way ANOVA followed by Tukey's multiple comparisons). The data are representative of three independent experiments (a–g). HRP-conjugated Goat anti-mouse secondary antibody (p/n orb345943) was used.