You have no items in your shopping cart.
Protein G Biotin Conjugated
SKU: orb348762
Description
Images & Validation
−Item 1 of 3
| Application Notes |
|---|
Key Properties
−| Purity | Protein G Biotin Conjugated was prepared from chromatographically pure recombinant Protein G. Assay by immunoelectrophoresis resulted in a single precipitin arc against anti-biotin and anti-Protein G. No reaction was observed against anti-Protein A. |
|---|---|
| Conjugation | Biotin |
Storage & Handling
−| Storage | Store vial at 4° C prior to restoration. For extended storage aliquot contents and freeze at -20° C or below. Avoid cycles of freezing and thawing. Centrifuge product if not completely clear after standing at room temperature. This product is stable for several weeks at 4° C as an undiluted liquid. Dilute only prior to immediate use. |
|---|---|
| Form/Appearance | Lyophilized |
| Buffer/Preservatives | Preservative: 0.01% (w/v) Sodium Azide. Stabilizer: 10 mg/mL Bovine Serum Albumin (rAlbumin) - Immunoglobulin and Protease free; Buffer: 0.02 M Potassium Phosphate, 0.15 M Sodium Chloride, pH 7.2 |
| Concentration | 1 |
| Expiration Date | 6 months from date of receipt. |
| Hazard Information | Non-Toxic |
| Disclaimer | For research use only |
Alternative Names
−ProG, Streptococcus G protein, Protein G Biotin Conjugated
Similar Products
−- Item 1 of 5
- Item 1 of 1
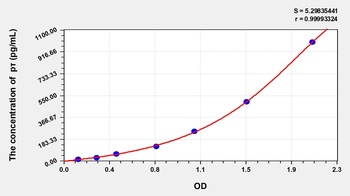
Human MAS Related GPR Member X2 (MRGPRX2) ELISA Kit [orb1088152]
Human
0.16-10 ng/mL
0.067 ng/mL
48 T, 96 T - Item 1 of 1
- Item 1 of 1
- Item 1 of 1
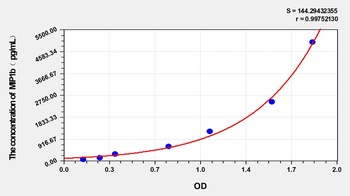
Pig Macrophage Inflammatory Protein 1 Beta (MIP1b) ELISA Kit [orb1173618]
Porcine
78.13-5000 pg/mL
31 pg/mL
48 T, 96 T


Quality Guarantee
Explore bioreagents carefree to elevate your research. All our products are rigorously tested for performance. If a product does not perform as described on its datasheet, our scientific support team will provide expert troubleshooting, a prompt replacement, or a refund. For full details, please see our Terms & Conditions and Buying Guide. Contact us at [email protected].
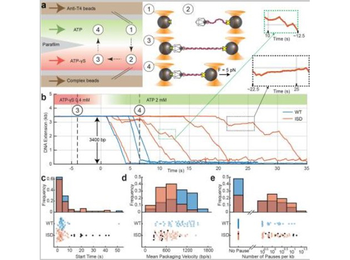
Motors containing inactive subunits exhibit slower start times, lower packaging speeds, and more pausing. a Schematic of the optical trapping assay to measure the packaging dynamics of a single T4 motor. A multi-stream laminar flow chamber (left) is used to manipulate samples and buffer. A bead coated with anti-T4 antibodies is captured in one trap in a flow stream containing ATP (green stream; step ①). Another bead conjugated with arrested T4 capsid–gp17-DNA motors is captured in a second optical trap in the stream containing non-hydrolyzable analog ATP-γS (red stream; step ②). The motor bound to DNA in the presence of ATP-γS cannot initiate packaging due to a lack of energy source. To form a tether between the bead pair, the beads are moved close for 1 s and separated apart to detect binding of capsid to antibody (step ③). After a constant force (F = 5 pN) load is applied to the tether, the traps are moved into ATP and packaging is detected as the decrease of DNA extension when DNA is translocated into the capsid by the motor (step ④). b Extension of unpackaged DNA vs. time, under constant force load. Packaging activity is observed within seconds of entering the ATP stream. Representative packaging trajectories with WT (blue) and ISD motors (orange) are shown. c Distribution of the start times of WT (blue, n = 44) and ISD motors (orange, n = 62), defined as the dwell time between entry into the ATP stream and the start of packaging. d Distribution of mean pause-free packaging velocity derived from each packaging trace. ISD motors (orange) show a lower packaging velocity than WT motors (blue). e Histogram of the logarithm of pause frequency, defined as the number of pauses per kb packaged. ISD motors (orange) exhibit more pauses than WT motors (blue) on average. Motors with long start times (black stars; c–e) have a lower packaging velocity and higher pause frequency. The number of trajectories used is indicated by n = #.
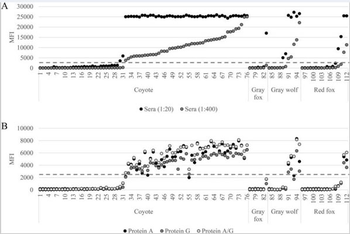
Signal response of Nobuto serum samples from 112 canids profiled with the F1-LPA. (A) Detection of F1 immunoreactivity was accomplished using a genus-specific secondary anti-IgG antibody. (B) Detection of F1 immunoreactivity was accomplished using biotinylated conjugates of staphylococcal protein A (p/n orb348752), streptococcal protein G (p/n orb348762), and staphylococcal protein A and streptococcal protein G (A/G), with sera diluted 1:20. The dashed line indicates the threshold for positive and negative samples using an S/N ratio of 10.
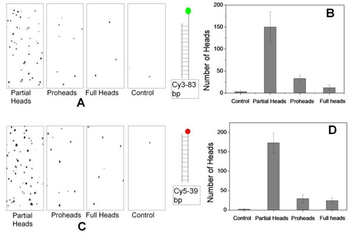
Single molecule fluorescence measurements of refilled heads. Quantification of packaging by single molecule fluorescence assay. (A and C) Fluorescence images of immobilized T4 heads packaged with Cy3 (83-bp) and Cy5 (39-bp) DNAs, respectively. One-fourth of the 70 µm ×35 µm imaging area is shown in each case. (B and D) Histograms showing the number of heads packaged with Cy3 or Cy5 DNAs. The number of heads showing fluorescence in more than 30 images was averaged in each case.
Quick Database Links
UniProt
UniProt Details
− No UniProt data available
Documents Download
Datasheet
Product Information
Request a Document
Protocol Information
WB
Western Blot (IB, immunoblot)
IHC
Immunohistochemistry
ELISA
Enzyme-linked Immunosorbent Assay (EIA)
Protein G Biotin Conjugated (orb348762)

- 0.0
Based on 0 reviews
Participating in our Biorbyt product reviews program enables you to support fellow scientists by sharing your firsthand experience with our products.
Login to Submit a ReviewAvailable Sizes
Select a size below